
This blog post continues with more complex DOT graphs to show some potential use case scenarios to add GEF DOT-based visualization support to the Eclipse IDE.
1. Visualization of UML Statechart Diagrams
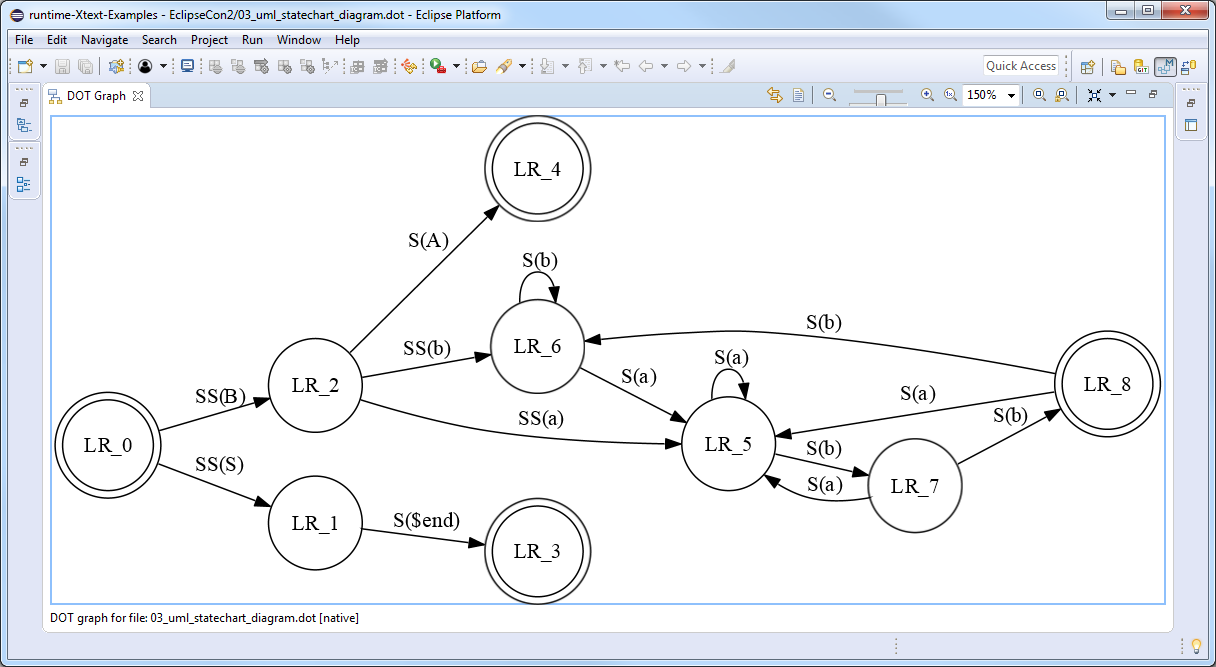
The finite_state_machine DOT graph definition describes the states (DOT nodes) and the transitions (DOT edges) of a state machine. The initial and final states are visualized by doublecircle node shapes, all other states are represented by nodes with circle shape. Note the usage of the edge label attribute specifying the text labels on the edges. The rankdir=LR graph attribute requests a left-to-right graph drawing in landscape mode.
digraph finite_state_machine {
	rankdir=LR;
	size="8,5"
	node [shape = doublecircle]; LR_0 LR_3 LR_4 LR_8;
	node [shape = circle];
	LR_0 -> LR_2 [ label = "SS(B)" ];
	LR_0 -> LR_1 [ label = "SS(S)" ];
	LR_1 -> LR_3 [ label = "S($end)" ];
	LR_2 -> LR_6 [ label = "SS(b)" ];
	LR_2 -> LR_5 [ label = "SS(a)" ];
	LR_2 -> LR_4 [ label = "S(A)" ];
	LR_5 -> LR_7 [ label = "S(b)" ];
	LR_5 -> LR_5 [ label = "S(a)" ];
	LR_6 -> LR_6 [ label = "S(b)" ];
	LR_6 -> LR_5 [ label = "S(a)" ];
	LR_7 -> LR_8 [ label = "S(b)" ];
	LR_7 -> LR_5 [ label = "S(a)" ];
	LR_8 -> LR_6 [ label = "S(b)" ];
	LR_8 -> LR_5 [ label = "S(a)" ];
}
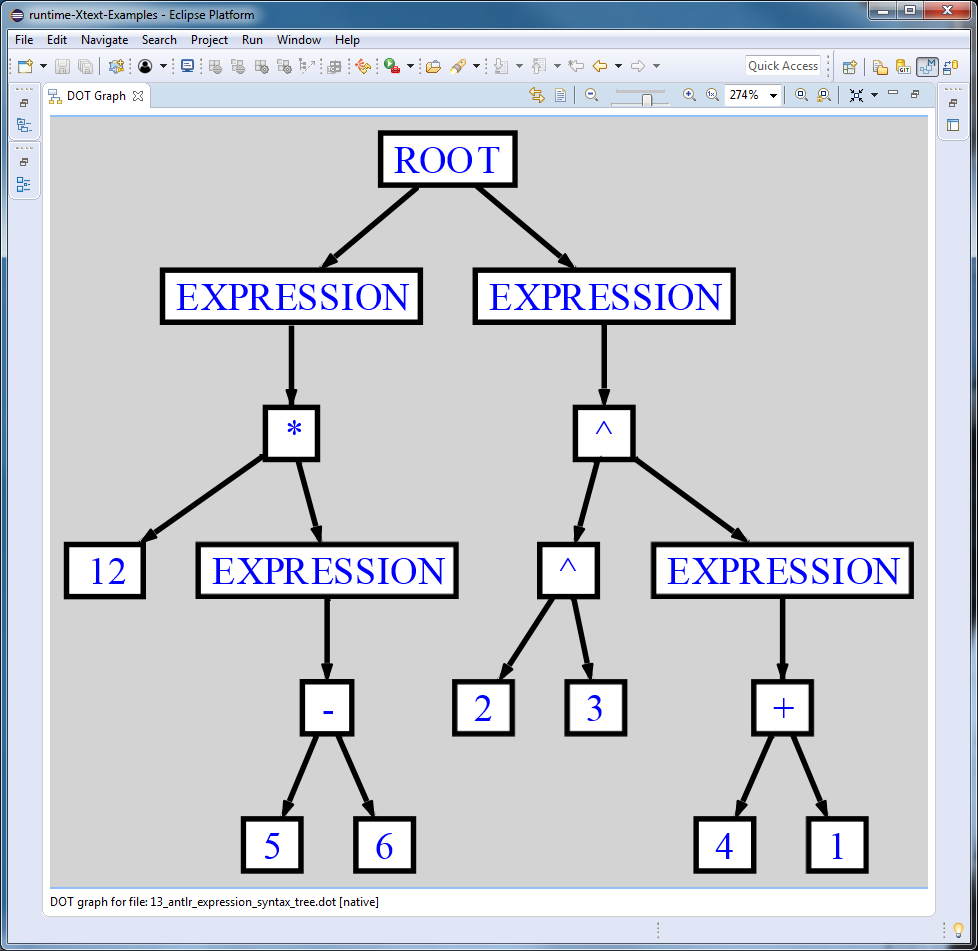
2. Visualization of ANTLR Abstract Syntax Trees
The org.antlr.runtime.tree.DOTTreeGenerator is capable of generating *.dot files from arbitrary ANTLR abstract syntax trees. The following DOT graph definition represents the AST of the12 * (5-6); 2^3^(4 + 1) expressions. The DOT graph is styled using the bgcolor, color, fillcolor, fontcolor and style DOT attributes.digraph {
ordering=out;
ranksep=.4;
bgcolor="lightgrey";
node [shape=box,
fixedsize=false,
fontsize=12,
fontname="Helvetica-bold",
fontcolor="blue"
width=.25, height=.25,
color="black",
fillcolor="white",
style="filled, solid, bold"];
edge [arrowsize=.5, color="black", style="bold"]
n0 [label="ROOT"];
n1 [label="EXPRESSION"];
n2 [label="*"];
n3 [label="12"];
n4 [label="EXPRESSION"];
n5 [label="-"];
n6 [label="5"];
n7 [label="6"];
n8 [label="EXPRESSION"];
n9 [label="^"];
n10 [label="^"];
n11 [label="2"];
n12 [label="3"];
n13 [label="EXPRESSION"];
n14 [label="+"];
n15 [label="4"];
n16 [label="1"];
n0 -> n1 // "ROOT" -> "EXPRESSION"
n1 -> n2 // "EXPRESSION" -> "*"
n2 -> n3 // "*" -> "12"
n2 -> n4 // "*" -> "EXPRESSION"
n4 -> n5 // "EXPRESSION" -> "-"
n5 -> n6 // "-" -> "5"
n5 -> n7 // "-" -> "6"
n0 -> n8 // "ROOT" -> "EXPRESSION"
n8 -> n9 // "EXPRESSION" -> "^"
n9 -> n10 // "^" -> "^"
n10 -> n11 // "^" -> "2"
n10 -> n12 // "^" -> "3"
n9 -> n13 // "^" -> "EXPRESSION"
n13 -> n14 // "EXPRESSION" -> "+"
n14 -> n15 // "+" -> "4"
n14 -> n16 // "+" -> "1"
}
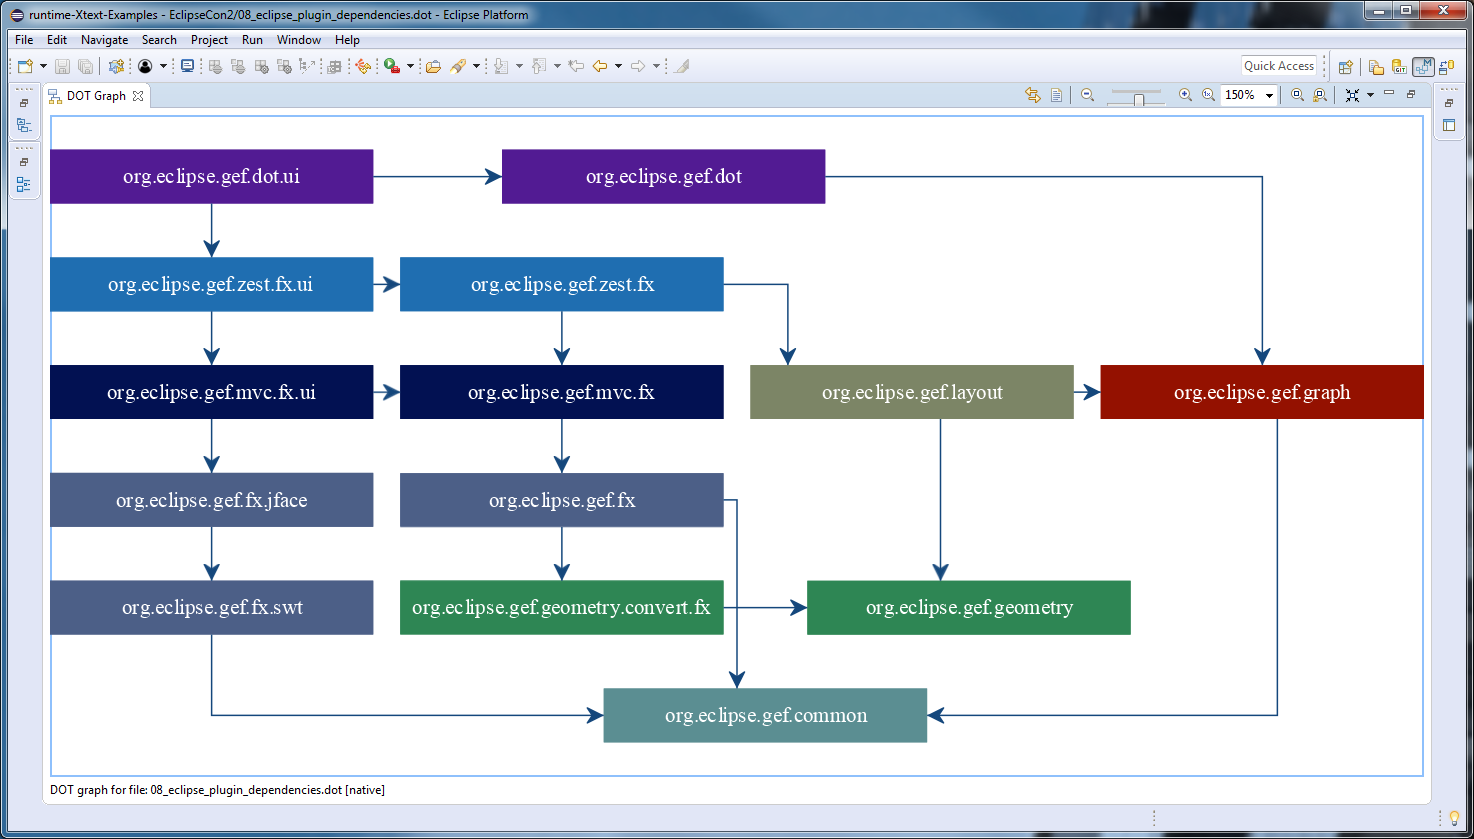
3. Visualization of Eclipse Plugin Dependencies
The following DOT graph definition describes the Eclipse Plugin dependencies of the different GEF components. Note how certain nodes are grouped by anonymous subgraphs and the usage of thegroup and rank attributes to ensure that the nodes are properly aligned both horizontally and vertically.digraph {
node[fontcolor=white shape=box style=filled width=3]
edge[color="#14477c" arrowhead=vee]
splines=ortho
// nodes
{
// GEF DOT
rank=same
node[color="#521B93"]
"org.eclipse.gef.dot.ui"[group="ui"]
"org.eclipse.gef.dot"[group="core"]
}
{
// GEF ZEST
rank=same
node[color="#1F6EB1"]
"org.eclipse.gef.zest.fx.ui"[group="ui"]
"org.eclipse.gef.zest.fx"[group="core"]
}
{
// GEF MVC
rank=same
node[color="#021152"]
"org.eclipse.gef.mvc.fx.ui"[group="ui"]
"org.eclipse.gef.mvc.fx"[group="core"]
}
{
// GEF FX
rank=same
"org.eclipse.gef.fx"[color="#4C5F87"]
"org.eclipse.gef.fx.jface"[color="#4C5F87"]
"org.eclipse.gef.fx.swt"[color="#4C5F87"]
}
{
// GEF LAYOUT
// GEF GRAPH
rank=same
"org.eclipse.gef.layout"[color="#7C8566"]
"org.eclipse.gef.graph"[color="#941100"]
}
{
// GEF GEOMETRY
// GEF COMMON
rank=same
"org.eclipse.gef.geometry.convert.fx"[color="#2E8654"]
"org.eclipse.gef.geometry"[color="#2E8654"]
}
"org.eclipse.gef.common"[color="#5B8E92"]
// edges
"org.eclipse.gef.dot.ui"->"org.eclipse.gef.dot"
"org.eclipse.gef.dot.ui"->"org.eclipse.gef.zest.fx.ui"
"org.eclipse.gef.dot"->"org.eclipse.gef.graph"
"org.eclipse.gef.fx"->"org.eclipse.gef.common"
"org.eclipse.gef.fx"->"org.eclipse.gef.geometry.convert.fx"
"org.eclipse.gef.fx.jface"->"org.eclipse.gef.fx.swt"
"org.eclipse.gef.fx.swt"->"org.eclipse.gef.common"
"org.eclipse.gef.geometry.convert.fx"->"org.eclipse.gef.geometry"
"org.eclipse.gef.graph"->"org.eclipse.gef.common"
"org.eclipse.gef.layout"->"org.eclipse.gef.geometry"
"org.eclipse.gef.layout"->"org.eclipse.gef.graph"
"org.eclipse.gef.mvc.fx"->"org.eclipse.gef.fx"
"org.eclipse.gef.mvc.fx.ui"->"org.eclipse.gef.fx.jface"
"org.eclipse.gef.mvc.fx.ui"->"org.eclipse.gef.mvc.fx"
"org.eclipse.gef.zest.fx"->"org.eclipse.gef.layout"
"org.eclipse.gef.zest.fx"->"org.eclipse.gef.mvc.fx"
"org.eclipse.gef.zest.fx.ui"->"org.eclipse.gef.mvc.fx.ui"
"org.eclipse.gef.zest.fx.ui"->"org.eclipse.gef.zest.fx"
}
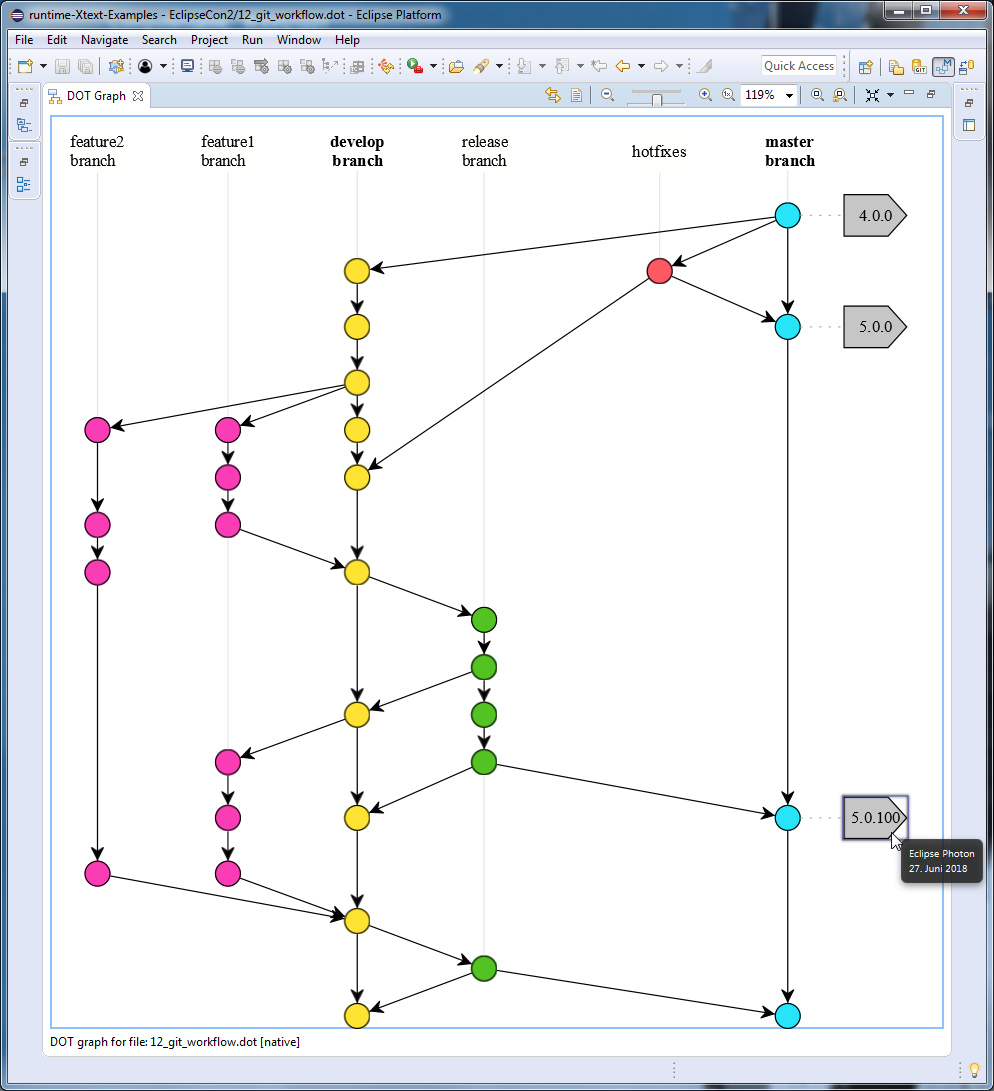
4. Visualization of Git Workflows
The DOT tooltip attribute can specify additional information that is shown while hovering over a certain node, e.g. the description and the timestamp of a git tag in a branching/merging workflow.
digraph {

	// ...

	// tags
	node [shape=cds, fixedsize=false, fillcolor="#C6C6C6", penwidth=1, margin="0.11,0.055"]
	t1 [label="4.0.0" tooltip="Eclipse Neon\n22. Juni 2016"]
	t2 [label="5.0.0" tooltip="Eclipse Oxygen\n28. Juni 2017"]
	t3 [label="5.0.100" tooltip="Eclipse Photon\n27. Juni 2018"]

	// ...
}
All these *.dot files (and also other ones) are hosted on the corresponding GitHub repository. For further information, I suggest you to take a look at the GEF DOT User Guide or visit my GEF DOT session at EclipseCon Europe 2018.
Comments