
When working with Simulink block diagrams, one major use case is to trace signals. Understanding how signal data are processed from inputs to outputs is especially useful when debugging your model. Since signal flows are easily scattered across various subsystems and hierarchy levels tool support is essential here.
But also in the process of model editing it is important to understand which impact a signal has on other parts of the system in order to better estimate the effects of a model change. Seeing the model from a single signal’s point of view might reveal redundancies or inefficiencies in your system design easier than staring at the model in its whole complexity.
This basically leads us to the following questions:
- Where does a signal start?
- Where does it end?
- Which blocks does it pass?
In this blog post, we will take a look on the signal tracing feature in Model Viewer which you can download as a free trial.
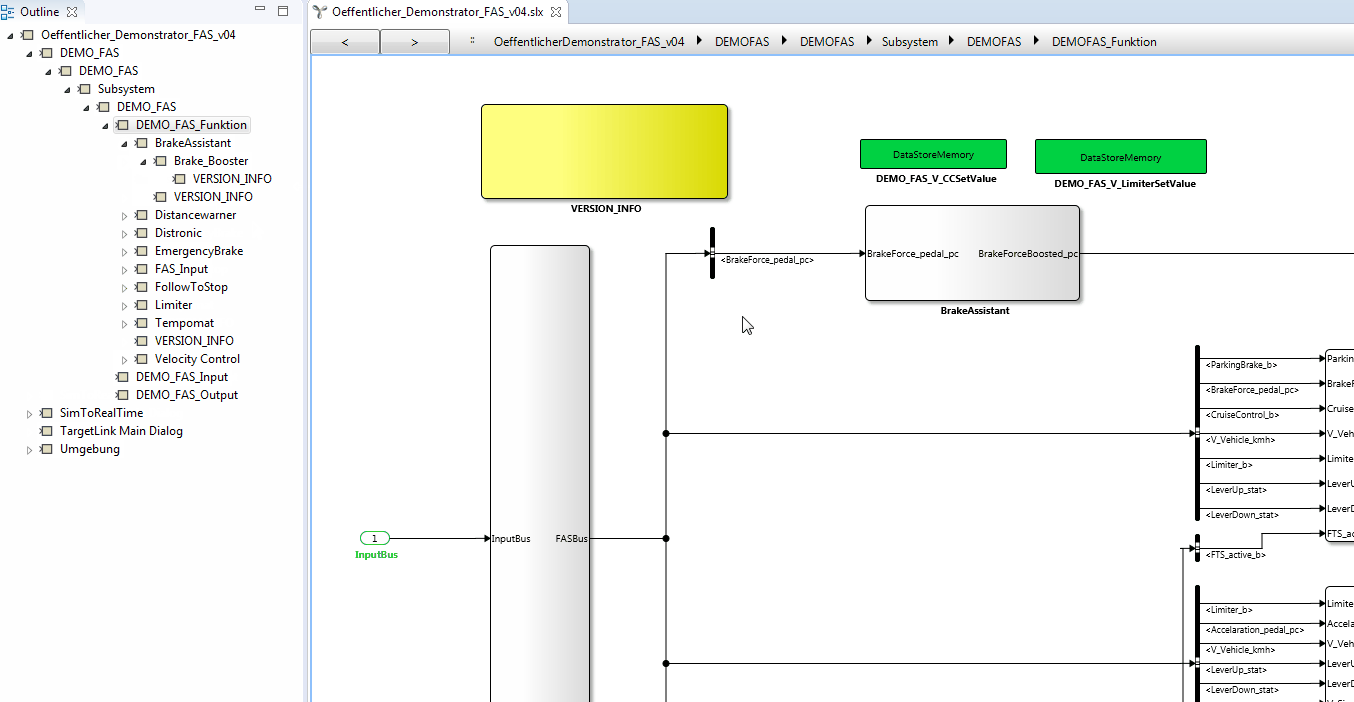
Like in Matlab Simulink, the highlighting mode provides an overview of a trace within a single diagram. However, a signal may affect several subsystems, and thus the trace might cover larger parts of the model. To get a better overview of the affected parts of the model, the outline tree on the left highlights the corresponding subsystems and thus helps navigating to the relevant model parts.
While the outline already provides a good overview, the visualization of the signal trace is still scattered across several diagrams, making it difficult to grasp the full scope of the signal. In order to get a complete view of the signal trace, a specific visualization is required, which contains all affected model parts, while unaffected ones are left out.
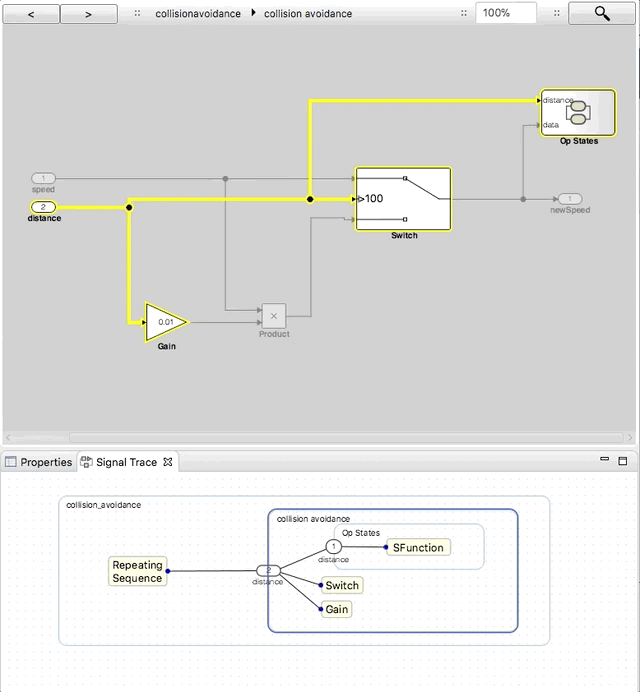
The Signal trace view shows the complete signal path along with all passed blocks and subsystems. This view also allows to quickly navigate to the model parts of interest and thus provides direction in a complex model structure. Please note that this view is is a unique feature of Model Viewer and not available in MatLab Simulink.
On The Fly Trace Continuation
Tracing down a signal to its source or target blocks is usually not an automated process. Some blocks need explicit user interaction. Consider, for example, a switch block: Its signal change is based on a condition that cannot be statically resolved. For such cases MatLab Simulink follows a step-by-step approach, requiring a user interaction for each step in the signal trace. In addition to that, Model Viewer allows to extend the signal trace to an arbitrary point in the model.
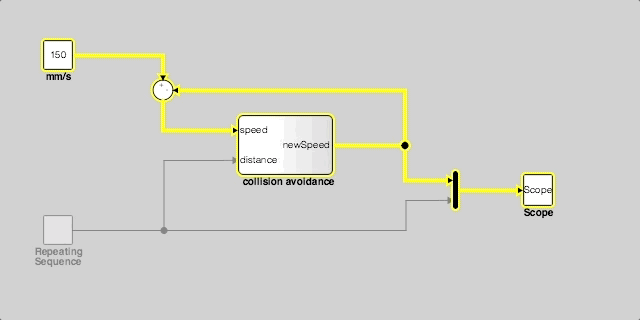
While the viewer is in tracing mode, you can hover with the mouse over an arbitrary line in the model. Model Viewer calculates possible paths from the current signal trace to the hovered line on the fly. The results are displayed as animated dots. If you agree with the proposed extension you can apply it with a double click. In that way it is possible to extend signal traces without navigating down to the lowest level of the system.
Summary
Signal tracing is a complex task that cannot be accomplished without tool support. Model Viewer does not only come with a highlighting mode, but also with enhanced capabilities for trace extension and a comprehensive signal trace visualization.
Moreover, we are currently working on making signal tracing even easier. You can try Model Viewer for free and let us know which features are missing to support your use case.

Comments