
While working in development projects it is necessary to observe the status of our project – whether to keep track ourselves or to inform our customers. Therefore, often reports have to be created what can be very time consuming and – referring to the number of requirements, artifacts and links – also confusing. In this article we will show you, how traceability can help you with that.
What do we need to track in projects?
In software projects we often have a list of customer requirements we need to realize. At the end of the project we need to ensure that all requirements are implemented and tested with a positive test result. To achieve this goal we need to track the project status regularly to answer a lot of questions:
- How many requirements does my project have?
- In which status are my requirements? Are they analysed and divided into sub-requirements, does an architecture exist, are they implemented, does a test case exist and if yes, what is the test result?
- How many requirements are complete, covered by tests and have a positive test result? How many have a negative test result so that the linked artifacts need to be adjusted?
- Are there any irregularities (e.g. a requirement that has various test cases could be an indication that it is too general)?
Also time is a central factor in such questions:
- How stable are my requirements over a specific period of time? How frequently do they change? How many requirements are added over time?
- What is the test progress since time x?
- How many requirements are completed over time?
- How many requirements need to be fixed until the next release?
While these questions are mostly relevant for customers and stakeholders such as project leaders and managers, every team member must know what needs to be done next – depending on their role in the project.
Keep track with traceability management
To keep track of all artifacts, links and requirements we need a well-arranged traceability management. Traceability allows us to analyse the current status of our project and to answer the questions above. Based on the linked (or not linked) artifacts we can identify the status of every requirement: requirements with no link are open, requirements with links to a positive test result are realized and requirements with links to other artifacts such as architectural components are still in progress. When data is extracted over different time periods, we can easily follow our project progress and create reports out of it. Because we can identify which artifacts of a specific type are not linked, also the individual roles in our team know what needs to be done next.
How to analyse the project status with YAKINDU Traceability
YAKINDU Traceability is a professional tool that helps us to describe and trace the life of our project requirements. To analyse the current traceability status it provides different means.
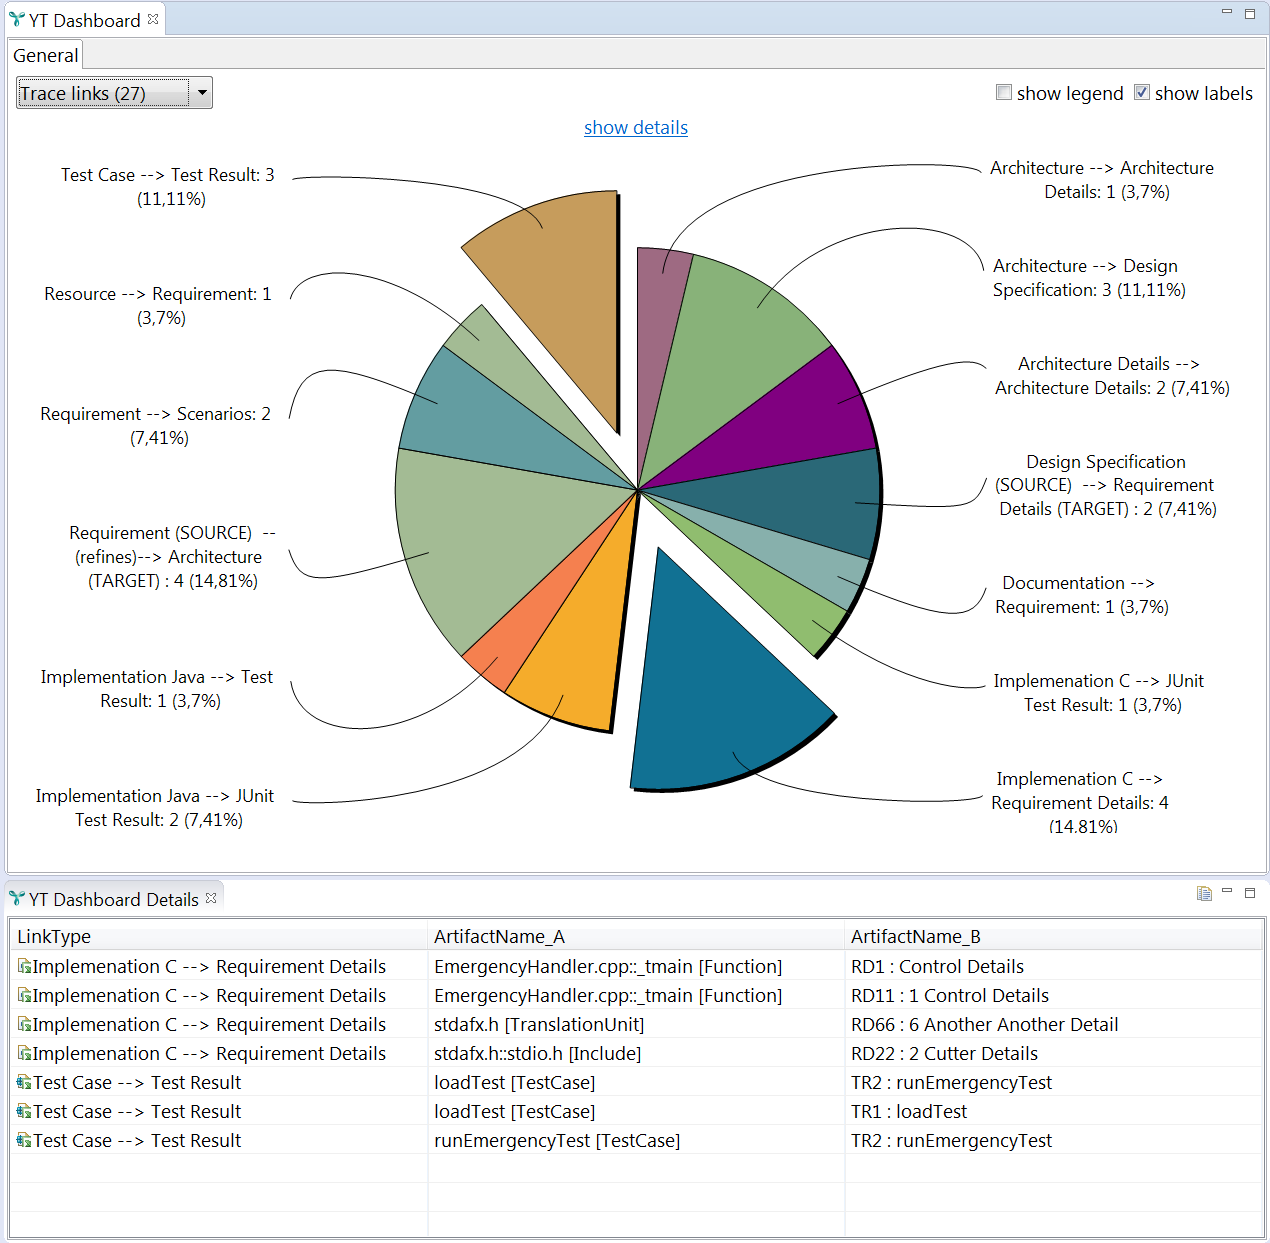
Observing the current link status in a dashboard
With the “YT Dashboard” we can visualise the current traceability status including the percentage of linked artifacts and existing links between specific artifact types. A pie chart representing this information on an abstract numerical level offers us a drill-down functionality, too: we are able to select the pie sections and to see in a table which concrete artifacts or links are affected.
Creating individual reports
We can also create individual reports with YAKINDU Traceability. By configuring individual report templates we can answer individual questions concerning our traceability data. Out of the box, YAKINDU Traceability comes with two standard reports: While the “statistics” report lists all existing links, the “coverage” report lists all artifacts and their link status regarding to a special link type (e.g. links between test cases and test results and artifacts of these types which have to link).
Creating a snapshot of your data
Sometimes it is necessary to create a snapshot of our current data. Therefore, we can extract the entirety of data visible to YAKINDU Traceability – the configuration, all artifacts and all links – as CSV-files. As these CSV-files are designed with referential integrity in mind, they can easily be imported into any Relational Database Management System for further evaluations.
For visualisation purposes, it is also possible to export a graph representing the configuration of YAKINDU Traceability or a graph representing all linked artifacts. This helps us e.g. to discuss configurations with colleagues or to get an overview on the whole traceability project.
Querying data
At the moment we are also integrating a query language into YAKINDU Traceability that allows us to query the traceability data individually in various ways. Just to name a few examples, it will be possible to display all artifacts of a specific type that have no link or artifacts with specific attributes linked or not linked to another artifact type. Also rules can be added based on the query results, e.g. that all requirements are highlighted that have more than ten test cases.
Various ways to track our progress
The different ways explained above all help you to better observe what is going on in your project. If you are interested in more details regarding the different possibilities, feel free to contact us. We are glad to give you more information about our tool or to show it to you in a live demonstration.

Comments