Composite states are a good means to bring order and structure to a statechart. However, as a statechart grows, it may easily become too big to give a comprehensive overview of the whole model anymore. Let's have a look at how subdiagrams can help you out. Imagine what would happen if a statechart grew by a few hundred additional states: even if structured into (possibly nested) composite states, the clearness decreases and the diagram would simply be too big to be printed or to give a clear overview on a screen. There is a simple solution, however: create subdiagrams! A subdiagram is a composite state “folded away” into an (almost) normal-looking leaf state.
You can create a subdiagram by selecting the state you want to expand and select “Create Subdiagram” in the context menu. After doing this you see a little decorator image on the state. Clicking on it opens the subdiagram showing an empty canvas of the subdiagram editor.
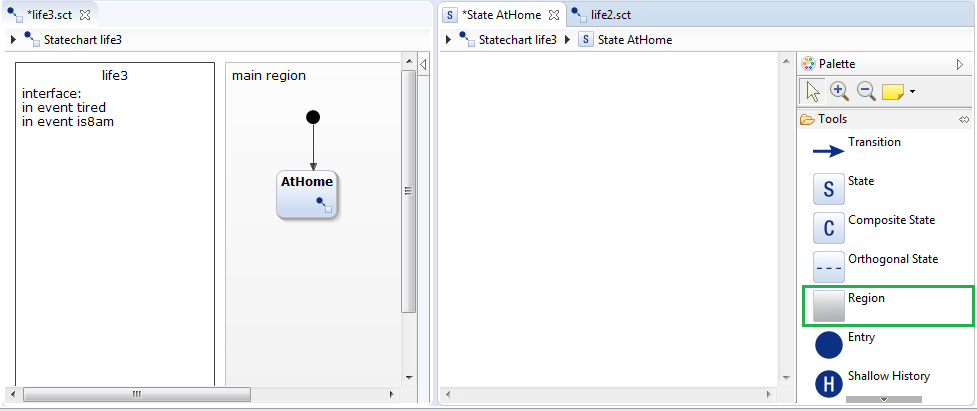
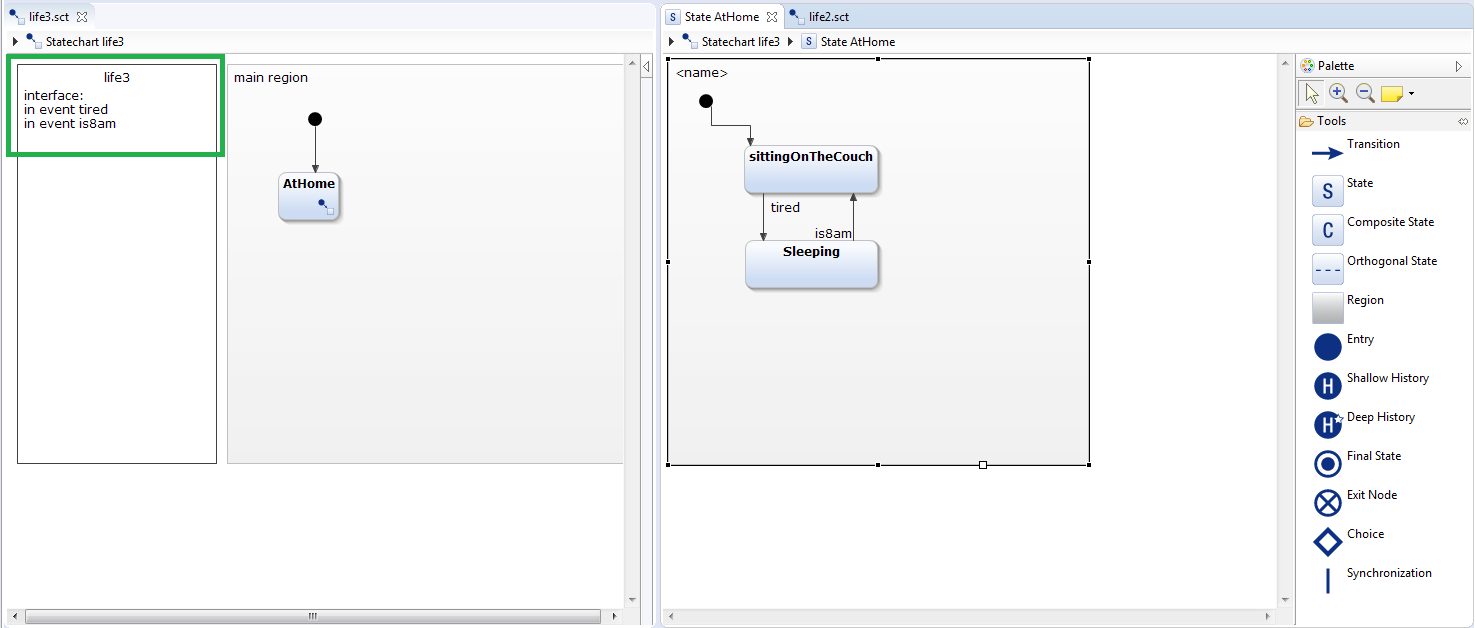
You need a region first and create your substatechart within this region. If you want to define variables and events you need to do this in the definition section of the parent statechart. The subdiagram does not have its own definition section.
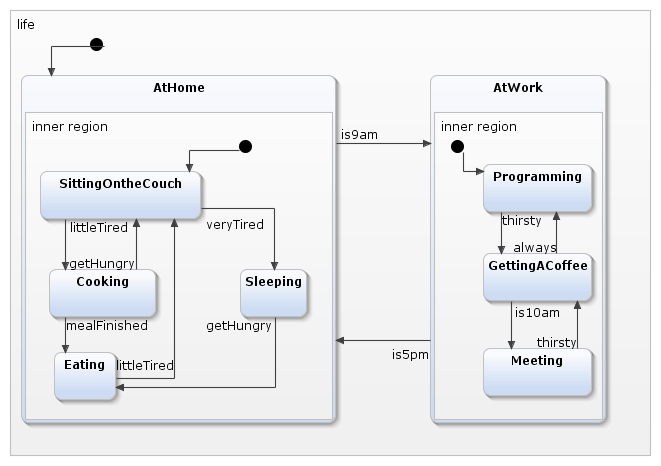
If you already have a large state machine you want to restructure it's best to use the “Extract Subdiagram” refactoring. It can be applied on composite states and orthogonal states. Simply select the composite state and then “Refactor” - “Extract subdiagram”. When refactoring is executed, all contained regions are extracted into regions within a separate diagram. This refactoring adds entry and exit nodes in the subdiagram as needed.
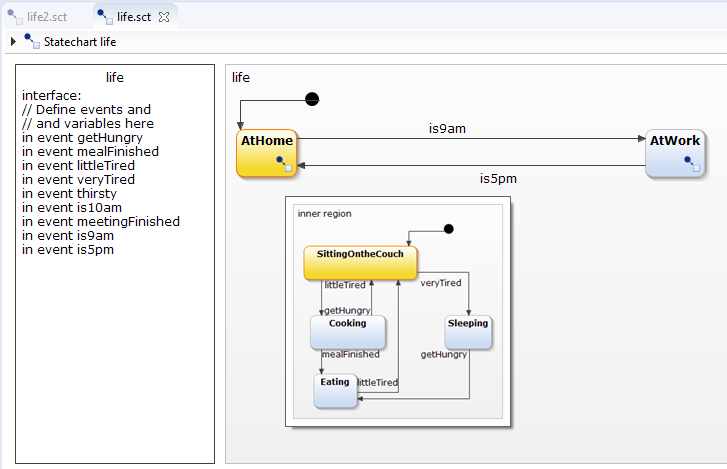
The following diagram has two composite states with a couple of substates:
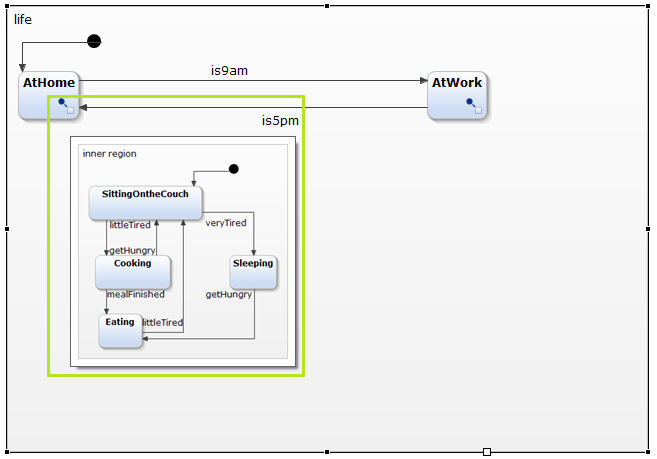
Now the composite state no longer clutters the diagram with all its internal details, but instead it appears almost like a normal state. The only difference is a small decorator in the lower-right corner of the state, indicating the existence of a subdiagram. When you hover over this decorator with your mouse you’ll see a small preview of the subdiagram.
A click on the decorator opens the subdiagram in a separate editor tab. The breadcrumb view at the top allows easy navigation throughout hierarchy levels.
Simulation of statecharts with subdiagrams work like simulations without subdiagrams. Refactoring does not affect the execution sequence. Start the simulation by selecting “Run as”- “Statechart simulation”. When the simulation reaches the subdiagram you can follow it by opening it in the editor or watch the hover image.
If you want to invert the “Extract subdiagram” refactoring simply use “Inline subdiagram” refactoring. Please note that entry and exit points that were introduced in the subdiagram will stay in the composite state as well.
Subdiagrams do not have any impact on code generation. You can generate code from statecharts with subdiagrams like you generate without subdiagrams.
If you work with large statecharts, try out subdiagrams and declutter your models. You can find additional information in our user documentation.

Comments