 Information: YAKINDU Statechart Tools Is Now itemis CREATE
YAKINDU Statechart Tools are used in various software and systems engineering projects of different sizes, starting from one-person-Arduino-hobby-projects to large commercial software projects in the medical or automotive domain.
Most of these different projects have one thing in common – there are multiple roles involved. Over time each role produces its own artifacts. For example, requirements engineers produce requirements and user stories, software developers create statechart models and generate source code out of it and quality assurance experts define and execute test plans.
Obviously all these artifacts are interconnected and influence each other. Thus, it is necessary to make the relations between these artifacts visible and, even more important, to maintain those links over time. The resulting graph can then be used to get an overview about the project state. This is commonly referred to as "traceability".
Why you really need traceability tool support
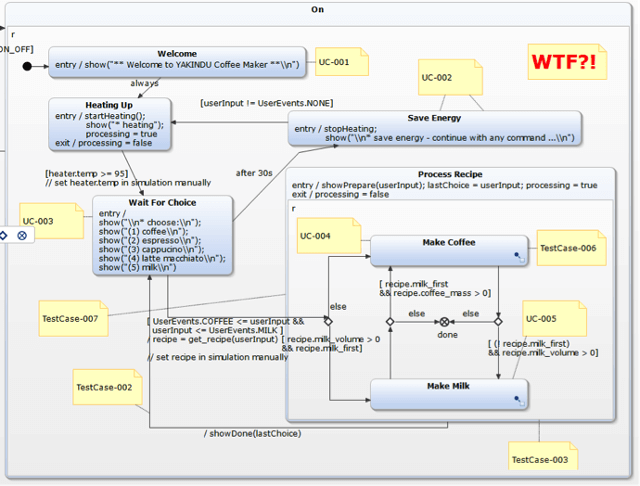
What we frequently see at our customers is that they make use of the note attachment feature to “trace” from different states or transitions to their requirements as shown in this screenshot:

While this seems to be a pragmatic approach to get requirements and the statecharts in sync there is a major flaw: It does not scale.
Imagine your project gets larger. The customer defines requirements on a more detailed level, test cases need to be linked to proof that each aspect of the statechart is covered by a test. Sometimes customers even demand that traces exist on code level, so that they can comprehend which statechart element leads to which line of code. Your clean, well defined and understandable statechart will sooner or later look like a mess:

Besides all the distraction introduced in the editor, there are some major drawbacks with this:
- The relevant information is not present. As the state machine engineer, you don’t need to know that the ID of the use case is ‘UC-1909’ but you want to know what ‘UC-1909’ actually is about. Most likely, the use case is written in another tool. That means when using Word or Excel, you have to copy the use case ID, switch to Excel and search for the ID again to find the relevant information. This is the easy part, go try this with IBM Doors or PTC Integrity.
- Link integrity is not maintained. Especially in modern software development, requirements change frequently while the implementation is already in progress. The worst thing that can happen is that you didn’t even notice that the requirement has changed. The result may be a working, well tested product which however does not meet the requirements. The same of course applies to all other kind of artifacts.
- The trace link is not navigable. Sometimes, the context information is not enough and you want to open the artifact in its native tool, for example for editing purposes. To follow a trace, you have to find the file, database or tool that contains the information and then find the information itself.
- No overview about the project state. Managers love reports. Once in a while they come to your office and ask for a project status report and they need it for the presentation tomorrow. Without a proper traceability tool, you have to evaluate all links between artifacts manually which is an error prone and time consuming task. As long as such a report is for internal use only, this might be annoying, but in the case of a customer audit, it can exceed “annoying” very quickly and be embarrassing and costly instead.
Let YAKINDU Traceability help you
As you can see, there are some good reasons for a dedicated Traceability solution, that can easily be added to your existing tool chain and adapted to your processes and artefacts.
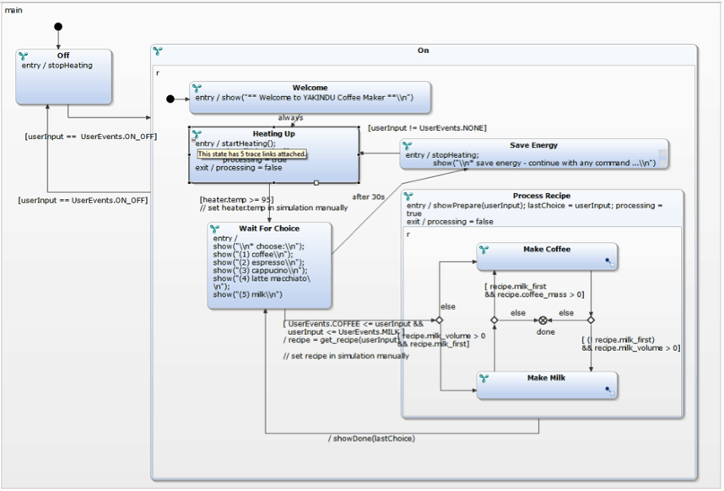
One of those tools is YAKINDU Traceability (YT). It integrates seamlessly with a wide range of different tools. The screenshot shows how the example above would look like using YT:

Every state that has a connection to a requirement, test case or source code is decorated with the YT icon in the upper left corner. A tooltip shows how many traces are connected with this state. If you click on the decorator, a popup menu opens and shows a list of all linked artifacts. All relevant context information is shown in the hover besides the artifact list and you can easily navigate to the artifact with a single mouse click. This is shown in the screenshot below.

The link integrity is maintained beyond tool boundaries and the user is informed about important changes when and where he needs it.

Now that all the trace information is available, you surely want to analyse it. For example to determine the impact of a certain requirement change, a coverage analysis, or a simple project status report for the management. For this purpose, YT comes with a query language that allows to create exactly those metrics you need, while the highly customizable reporting engine, allows to export the results in different formats.
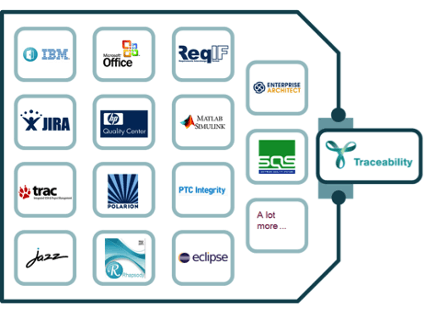
But this is just an example how tools are integrated with YT. It is based on adapters that interface with a large variety of third party tools (e.g. IBM Doors, PTC Integrity, Matlab Simulink, Enterprise Architect, MS Excel, MS Word, Eclipse and many more).

If you are interested in other integration scenarios get in contact for a free webinar. We're looking forward to your request!

Comments