 Information: YAKINDU Statechart Tools Is Now itemis CREATE
Recently I heard a radio spot about the Ferris wheel in Vienna. It celebrates its 120th anniversary this year. While thinking about how to model the control of such a Ferris wheel I realized this might be a good example to explain YAKINDU Statechart Tools’ simulation feature to you.
Simulating a statechart model means to execute it, raise events manually, have time-based and other events being triggered automatically, and observe the model’s behavior. You can run multiple state machines in parallel and even multiple instances of the same state machine.
First, let us take a look at the operation control of such a big wheel. It needs a switch to turn it on, it has a blinking or static lighting, plays music and it moves or stands still. For my state machine I assume that the wheel has similar standing and moving periods. However, the one in Vienna has special cabins you can book for business meetings or dinners. These may take longer than one turn of the wheel. Maybe you try to model these advanced features. Let me know 😉
This is the statechart of the big wheel modeled with YAKINDU Statechart Tools:

The model is very simple. I make no claim to be close to reality. In this case it is more important to explain the general behavior and show the simulation feature.
The model consists of two main states. A simple state Off and a composite state On with three parallel regions: one for the wheel movement, one for the lighting and one for the music. The statechart knows four events turnOn, turnOff, stop and speedUp. The events turnOn and turnOff turn the whole big wheel on and off. Stop and speedUp are raised by the wheel states to indicate whether the wheel stands still or moves. When it moves the lighting should be dynamic and it should go static when the wheel stands still. Now the statechart is ready to be simulated.
Running the simulation
You have several options to start a statechart simulation. The simulation execution comes as a launch configuration within the Eclipse infrastructure. To understand this mechanism it is helpful to know what a launch configuration is.
You can start the simulation of a statechart by right-clicking on its .sct file and selecting “Run As → Statechart Simulation” in the context menu. YAKINDU Statechart Tools remembers previously executed statecharts. Thus you can re-run a simulation by clicking on the run symbol in the menu bar or by selecting “Run → Run History → <yourstatechartnamet>.sct”. 
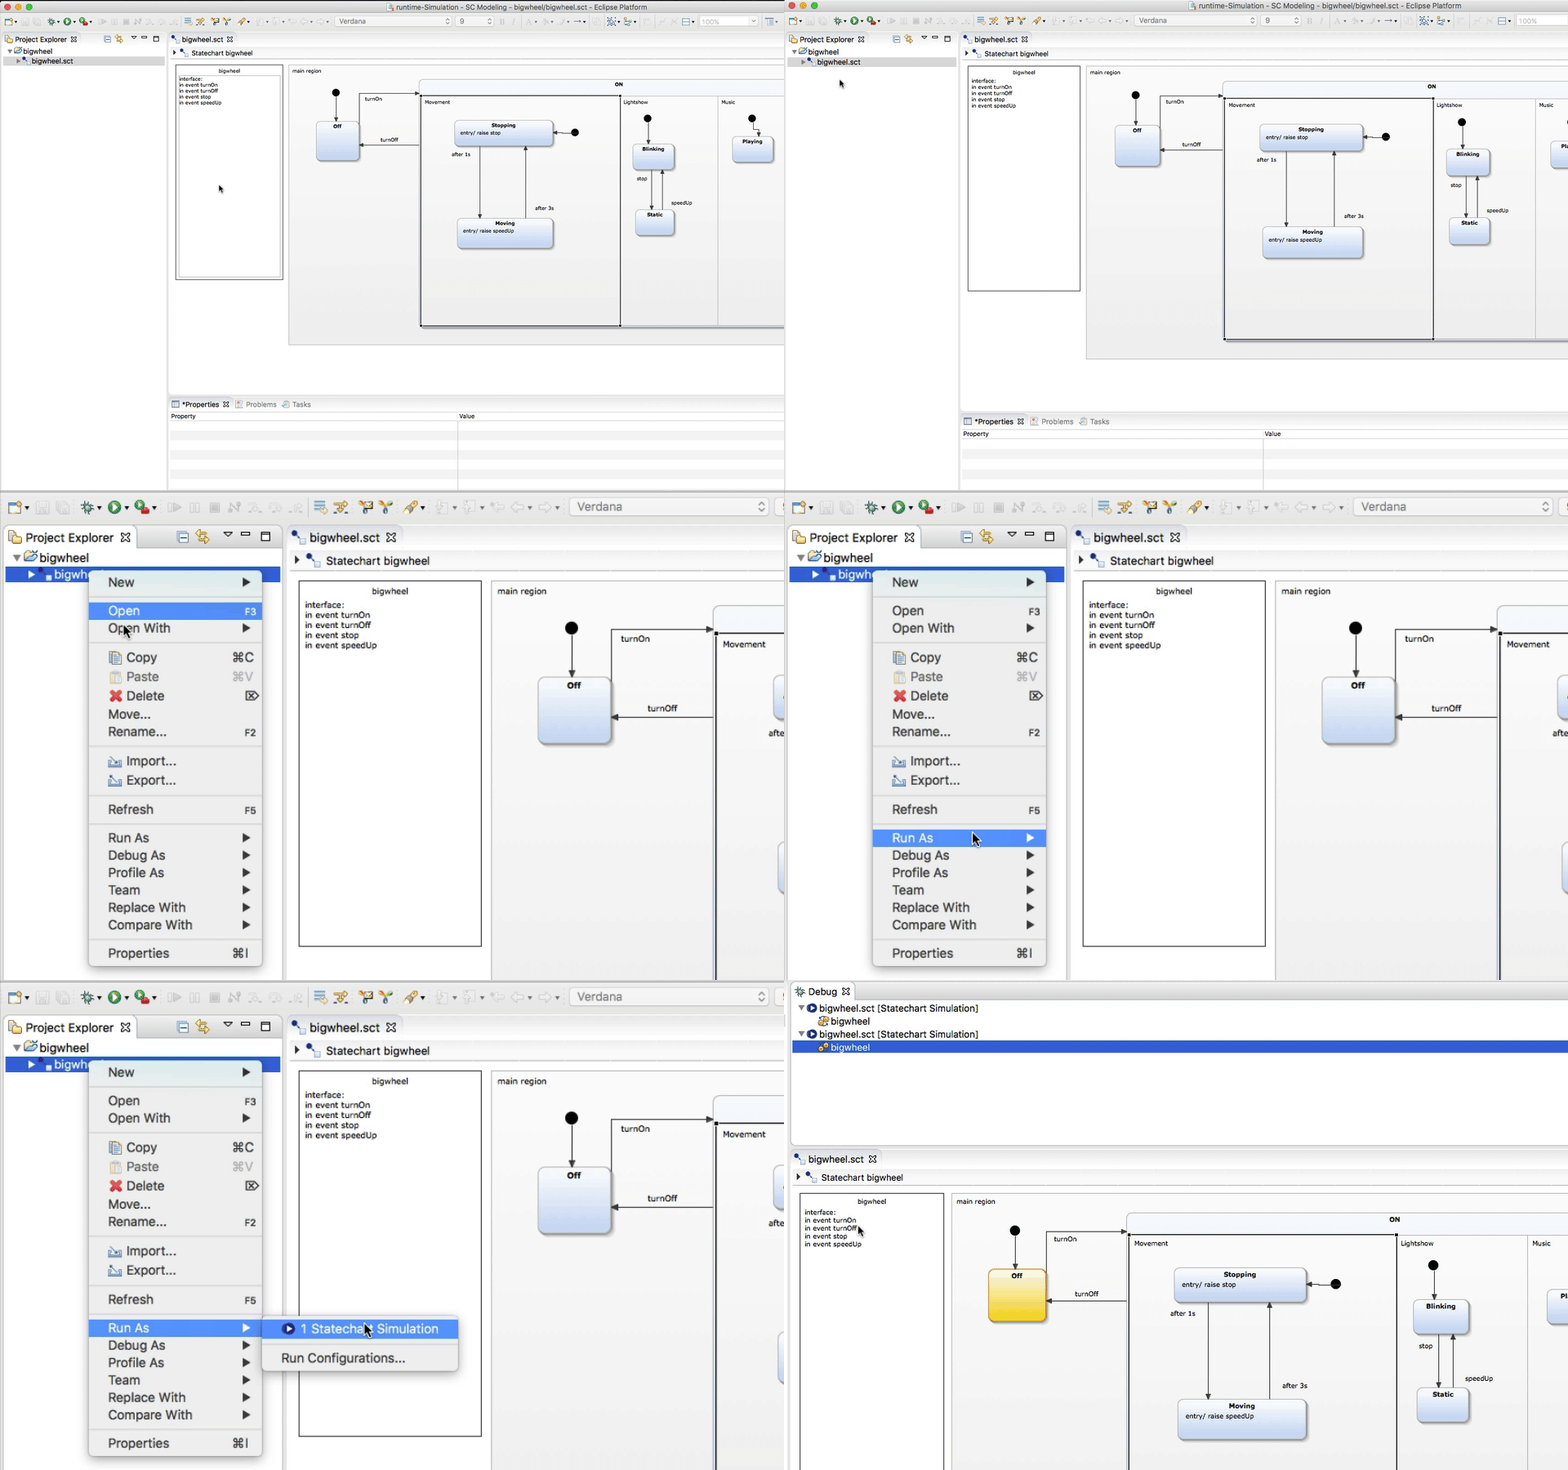
Simulation perspective
When the simulation starts, a dialog to switch the perspective pops up. YAKINDU Statechart Tools currently uses two perspectives: the Modeling and the Simulation perspectives. A perspective is a fixed set of editors and views on the screen. It is also an Eclipse concept.
The simulation perspective consists of the following parts:
- the project explorer to show the workspace (left side)
- the debug view to show which simulations currently run (top)
- the simulation view shows the events you can trigger (right bottom, green framed)
- the outline view to show the whole statechart as image (top right)
- the editor that presents the statechart (bottom)
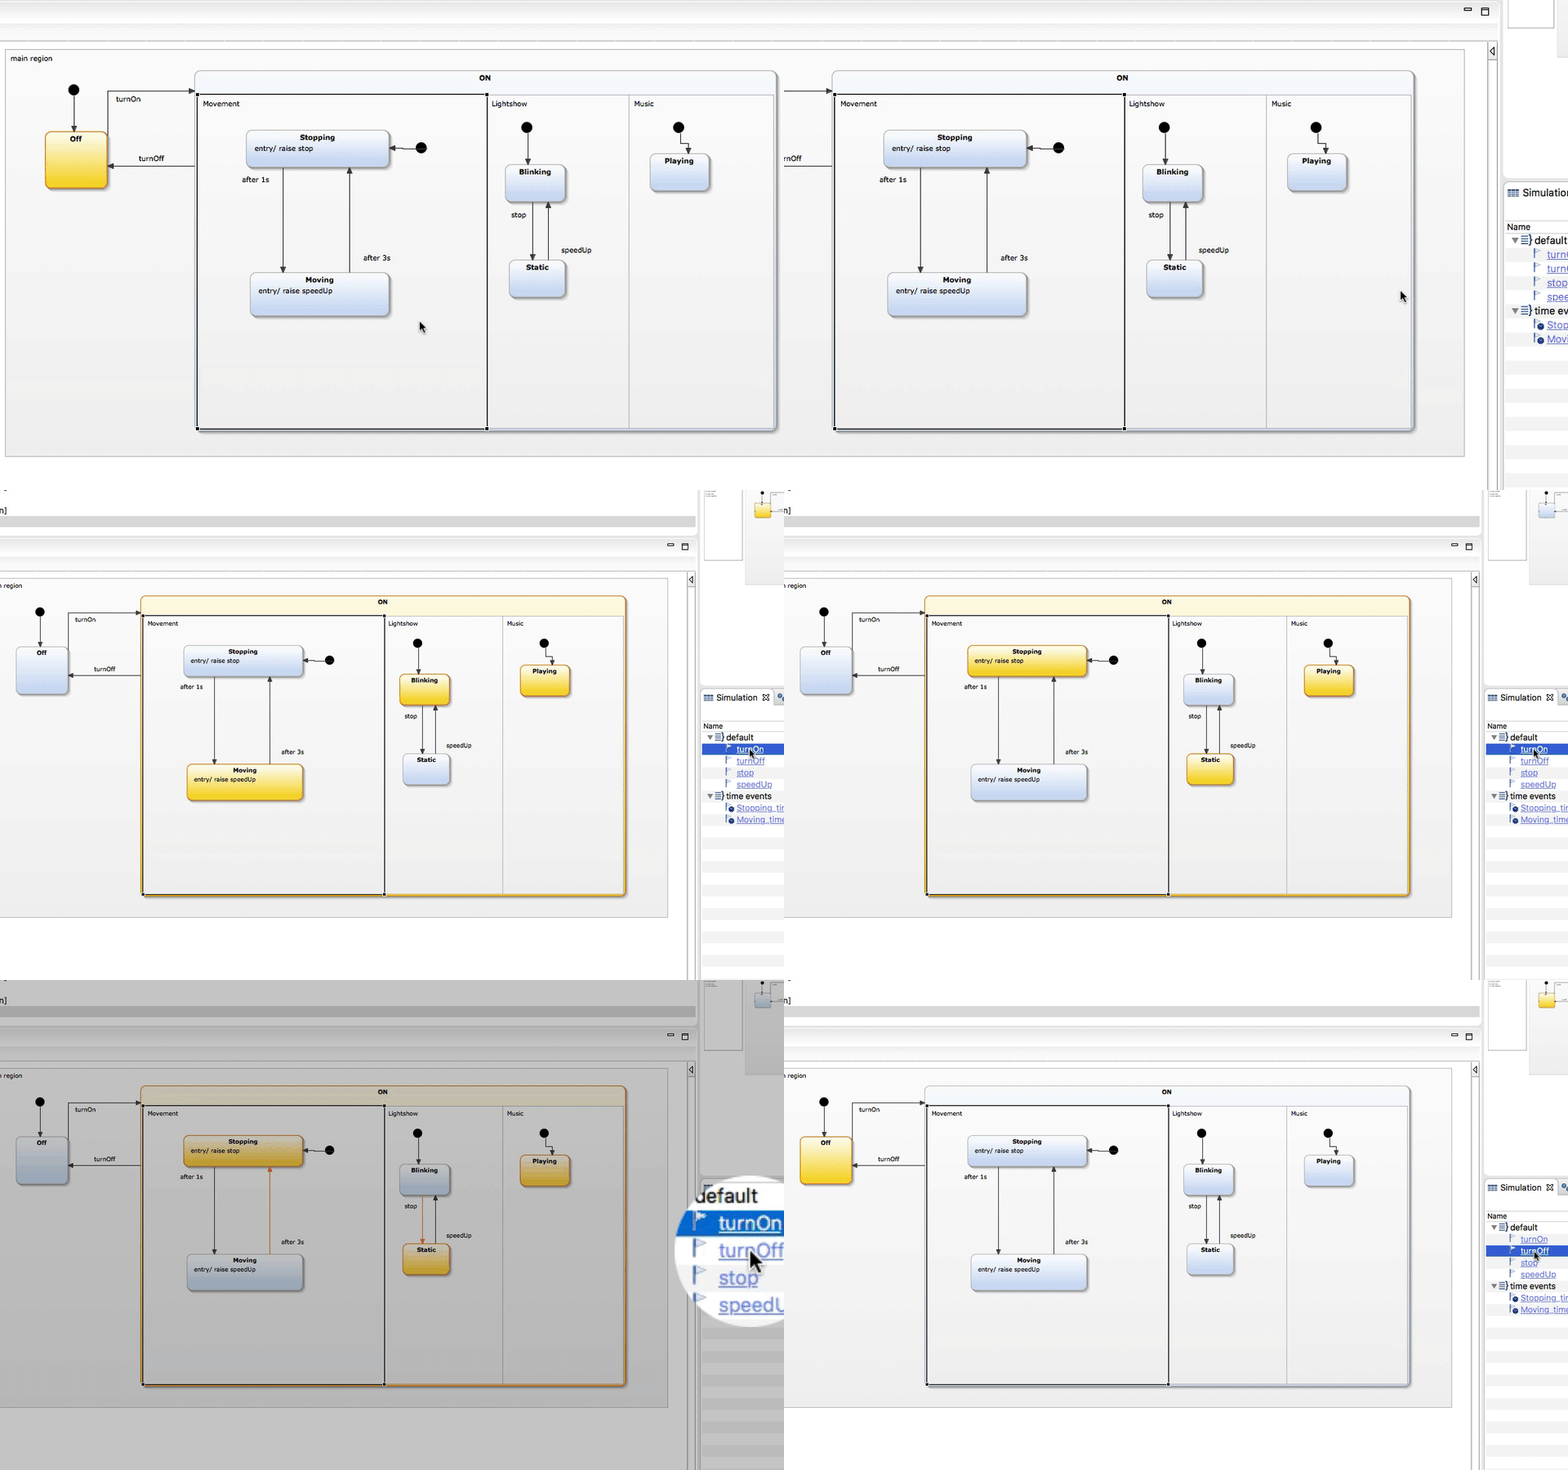
Simulation view
Now we have started the simulation. The Off state is active and colored yellow. The simulation does not proceed, because it waits for the turnOn event. We can raise this event by clicking on this event in the simulation view. As soon as we did so, the simulation proceeds and runs through all the time-based states. At each point in time, the currently active states and transitions being taken are colored in yellow and orange, respectively.
The simulation view gives you an overview of all events and variables of the current statechart. You can also change the values of the variables.
You can control the simulation using the buttons in the toolbar. You can suspend the simulation temporarily or terminate it.
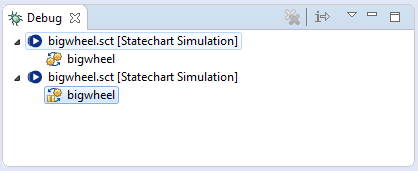
You can start several instances of the same simulation concurrently. The debug view shows the different simulation instances.
Time-driven reactions
YAKINDU Statechart Tools provides you with two different means to invoke reactions:
- by timed triggers, or
- by events.
You can use timed triggers on transitions like
after 1s
every 3ms
The statechart uses these kinds of statements within the Movement region: after one second it switches to Moving. Here it stays for three seconds. Then, “after 3s”, the state machine switches to Stopping, so passengers may go on and off the waggon.
Event-driven reactions
The transition from the Off to the On state is triggered by the event turnOn. The lighting transitions are triggered by the events stop and speedUp. If you take a closer look at the states in the Movement region you see that these events are raised by the entry reactions of the states Stopping and Moving, respectively:
entry / raise stop
entry / raise speedUp
The keyword entry indicates that the event is raised on entering the state. You can also raise events on exiting the state with the following statement
exit / raise speedUp
If you need more information about entry/exit actions, please consult section “Reactions” in the YAKINDU Statechart Tools User Guide.
Professional features
The Professional Edition of YAKINDU Statechart Tools offers an additional breakpoint mechanism that lets the simulation suspend when it reaches a specific state or transition. The Professional Edition gives you also the possibility to take snapshots of simulation states and restore them later.
Simulation colors
If you want to change the highlighting colors of the simulation, you can do this in the preferences. To open the preferences dialog, select “Window → Preferences” and proceed to “YAKINDU SCT → Simulation”.

This article gave you a quick overview of the simulation feature. If you like to know more details, please consult the YAKINDU Statechart Tools User Guide or get in touch with us.
Of course you can run this example within your YAKINDU Statechart Tools.
Comments