
 Information: YAKINDU Traceability Is Now itemis ANALYZE
A manager of a single project, working closely with a small team on a daily basis, can fairly easily know the status of the project. However, a manager of several projects, maybe a department manager, manager of a large branch of a company, or even the manager of a company, will find it harder to have a personal feel for the status of the project he/she is responsible for, and will rely on information provided by other people and other sources.
As a successful manager of multiple projects, I would want to have at my fingertips a reliable source of information that provides the status of all the projects I'm managing.
Initially, I want a very high-level, Red-Amber-Green (RAG) status, that can give me an immediate visual indication about the overall status of my projects, in particular indicating any problematic projects.
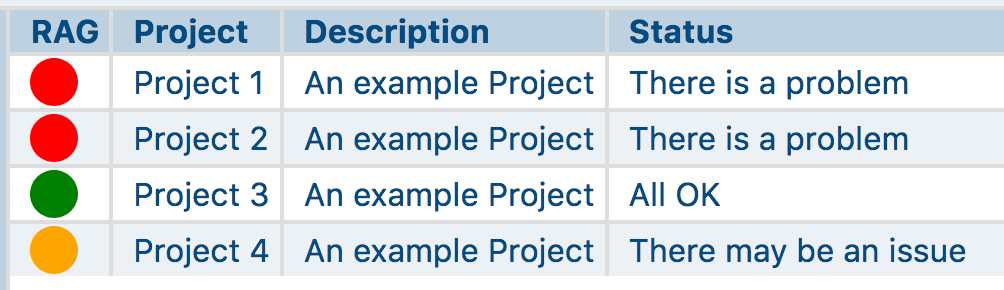 Fig 1: RAG Status
Subsequently, I want to be able to get more details about any specific project, in particular I want to know details that contribute to the status.
Typically, for any particular project, there are a number of key metrics (Key Performance Indicators, KPIs), with respective bounds that the metric value must fall into. The overall status (shown above) depends on the value of these key metrics and their position with respect to the bounds. The overall status of the project is Red or Amber if any of these metric values fall outside the bounds.
Different projects may have different key metrics, and different bounds. For example, I might define 5 key metrics that form the status of a project as follows:
- Budget: Does the actual cost of the project correspond to the estimated cost?
- Schedule: Is the current work progress on the project meeting the planned schedule?
- Quality: Is the result of the project (the product) meeting the expected quality criteria?
- Stability: How stable are the intermediate work products, e.g. are things frequently changing?
- Resources: Are the estimated resource (people) requirements of the project expected to be met with respect to project assignments, holiday, sickness, etc?
The key metrics can be nicely visualized using a Radar Chart (Spider Diagram) that also shows the bounds (Fig 2). In this case I define 2 sets of [min,max] bounds. Green means all key metrics are within the bounds. Amber (yellow) means they are between the two sets of bounds and Red means the value is outside of both sets of bounds.
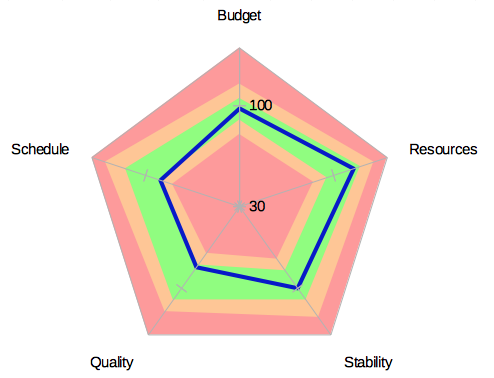
Fig 2: Key Metrics
I define each of these metrics so that a value of 100 is the ideal, all is perfect value, i.e,
- Budget: 100 = project is meeting the budget. 120 = project is 20% over budget. 80 = project is 20% under budget. (Yes too much under budget is a problem because it indicates something is wrong, even if it is simply the estimation.)
- Schedule: 100 = project is on schedule. 80 = 20% of the milestones that are due are still not met. 120 = 20% of milestones not yet due have been met.
- Quality: 100 = project is meeting expected quality. Lower value indicates that project is not meeting expected quality. Higher value indicates quality is too high. (Yes this can be a problem as quality costs.)
- Stability: 100 = project items are changing at expected rate. Higher value means project items are changing faster than expected. Lower value means project items are changing too slowly.
- Resources: 100 = project has required resources allocated. 80 = project is 20% under resourced (insufficient number of developers allocated to meet the expected workload). 120 = project is 20% over staffed.
Of course, in addition to the current state of the project, I also want to see how each of these metrics has changed over the lifetime of the project (Fig 3).
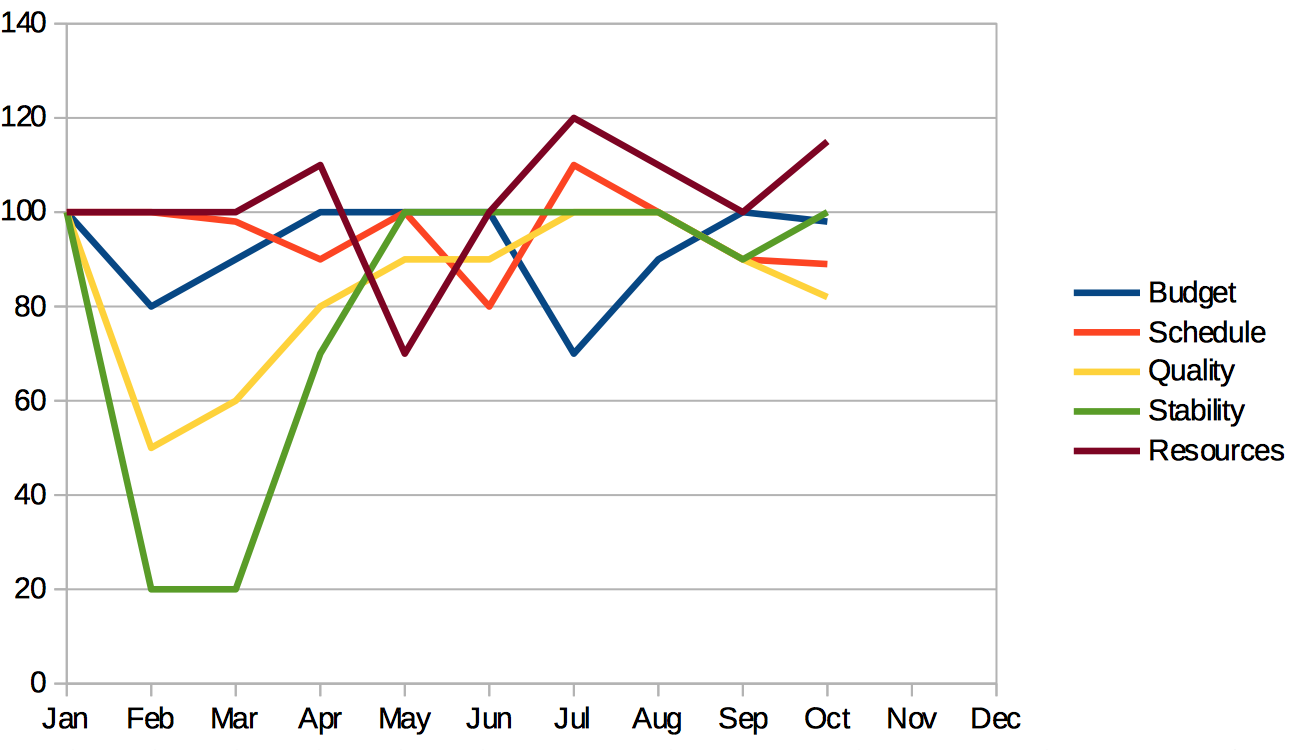
Fig 3: Key Metrics Over Time
The difficulty, of course, is getting values for each of these metrics that are meaningful, accurate and reliable.
Manual Reporting
A possible method is to ask each of the project team leaders to provide me with these values on a weekly (or monthly) basis. However, this approach has a number of significant drawbacks:
- It is highly time consuming for the project leader to provide these values.
- It is unreliable, the project leader may not have time, and may well simply estimate the values and different project leaders find different ways to calculate the values.
- It is probably inaccurate as it is highly likely that the information is out-of-date by the time I receive it.
- The actual status of a project moves faster than the report can be created. (Unless work stops while the report is written!)
Using Traceability data
A far more reliable and accurate way, to gather my key metrics, is to make use of traceability data. This removes the effort from the project leader (who can instead focus on leading the project rather than on providing reports) and gives me a consistent, accurate and reliable way to measure the status of all the project under my responsibility.
I will illustrate, as an example, how to calculate the Schedule metric using traceability data that is collected automatically from data that is created by the project team as part of their usual working procedure.
Schedule Definition
The schedule for a project is defined by a number of Milestones, each of which has a defined date and a set of Features that are expected to be complete.
The project can be considered to be 100% on schedule, if every Milestone that is due by the current date has been met. A Milestone is met if all the Features allocated to it have been implemented and tested by the defined Milestone date and a new Binary Artifact has been published. Breaking this down we can state that:
- All Requirements must have at least one Integration Test defined against them, and all those tests must pass.
- All Code that implements a Requirement must have a Unit Test coverage of 80%, and they must pass.
- All tickets SubTasks and Bugs that are related to the allocated Features must be ‘done’.
- There must be a Binary artifact (e.g. jar file) corresponding to a release Build, that is Published.
The project team uses an Agile development process as follows:
- The Milestone information is defined and managed using an Issue Tracking system, such as JIRA.
- Each Feature is defined as a Story in JIRA (JIRA-Story), and assigned to a specific JIRA-Version. (Not the version of JIRA, but rather the Version of the Project/Product that is being managed by JIRA – a concept provided by JIRA.)
- Each JIRA-Version is a Milestone, and has a specified Release (or due) Date.
- The project team uses JIRA-Agile to manage the work, Features (JIRA-Story) & JIRA-Bugs are allocated to the JIRA-Version, and worked on in Sprints.
- The team members do work (implement Code and Tests), and commit their work to the source code repository (e.g. Git or GitHub).
- The Continuous Integration system (e.g. Jenkins), Builds the Code, runs the Unit and Integration Tests and produces a report of the Test Results.
- When a ticket (JIRA-Story, JIRA-Bug, JIRA-SubTask, etc) is complete it is marked as 'Done'.
- When all the tickets assigned to a JIRA-Story (Feature) are complete, the JIRA-Version (Milestone) is considered complete, and it can be Released.
- The JIRA-Version is marked as ‘released’ and a ‘Release Build’ is triggered manually on the CI system. The result of the release build is uploaded to an Artifactory repository.
To determine if the project is on schedule, I could simply look at the Versions of the product in JIRA and see that they are marked as released, by the planned release date. I can even get JIRA to show me charts about the project status (as recorded in JIRA).
Conclusion
So why do I not simply use JIRA to monitor the project? Because, there is more to this problem than simply what is recorded in JIRA. The tickets might "say" that everything is complete (done), but where is the hard evidence (the Test Results and code-coverage) that the Features allocated to the Milestone really are completed? To get a true and accurate calculation about the project status I want to gather data from multiple sources, i.e from all the different tools that are used by the project team. No single tool, on its own, provides the complete status information.
I need to be able to query a model of information that is gathered from a number of different sources, that integrates and links data from all the development tools. Such a model is often constructed as part of the definition of a project development process and is subsequently used for analysing traceability across the many diverse artefacts that are created as the project progresses.
This model is known as the Traceability Information Model (TIM), and tools such as YAKINDU Traceability (now itemis ANALYZE), make it possible to gather the required information from multiple sources and construct a traceability graph for a project. Using this graph it is then possible to execute appropriate queries and calculations that provide values for the project metrics I defined.

The following post (Part 2) will illustrate how to define and calculate one of these metrics.
Comments