
 Information: YAKINDU Statechart Tools Is Now itemis CREATE
Did you know you can style your statecharts with YAKINDU Statechart Tools? For example, it might be useful to highlight certain states by color – especially when dealing with large state machines. You can group states by color and point out semantics by coloring states. Or maybe you want to mark statecharts that need to be reworked by color. Therefore it's our "feature of the month".
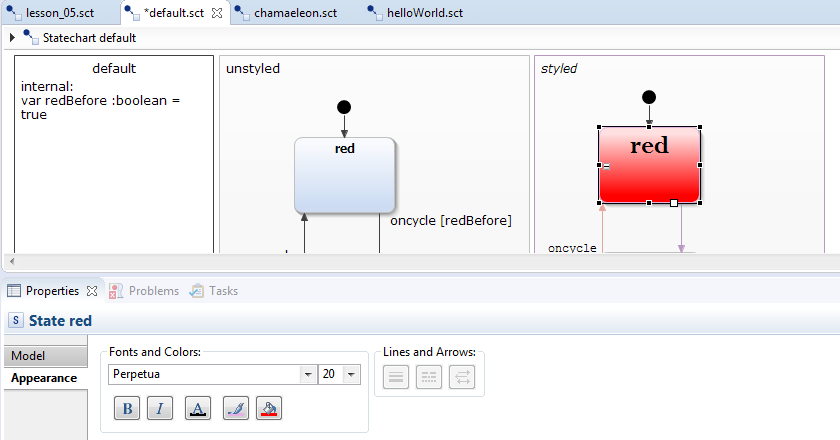
Look at the image below: Statecharts usually look like this unstyled traffic lights statechart. But it is also possible to change colors and fonts of transitions, states, and regions.

YAKINDU Statechart Tools offers two different ways of changing the colors of regions and states:
- changing the default design
- changing only specific states
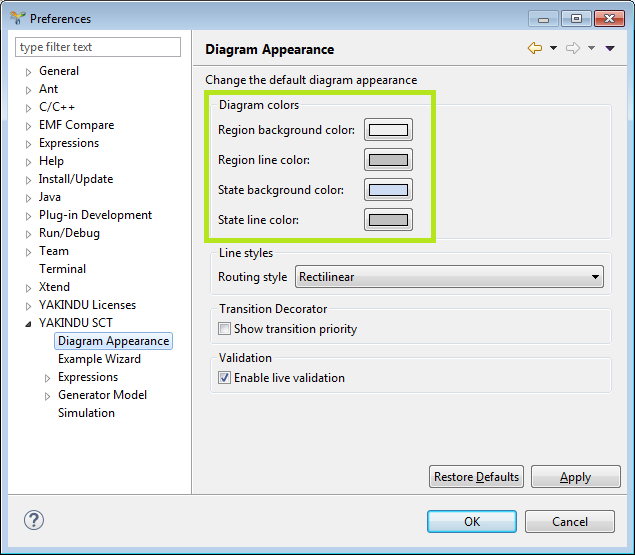
If you want to change the default coloring of statecharts open the preference page (Window → Preferences → YAKINDU SCT → Diagram Appearance). Here you can change the colors of regions, states, and their borderlines. Please note that changed default colors will apply to new objects only. States and regions you have created so far will remain unchanged.
The other way is to change the design of particular states individually. To do this, select the state (or multiple states) you want to colorize. In the context menu, select “Show Properties View”. There are two tabs, “Diagram” and “Appearance”. On the “Appearance” tab, you can change background color, line color, and the font of a single state.
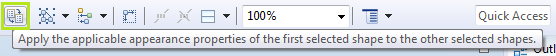
Once you colorized one state, you can copy this style by selecting the colorized state first and the target states afterwards. Then click at the “Apply the applicable appearance properties of the first selected shape to the other selected shapes” symbol, which is highlighted in the image below.
You can also colorize transitions. To colorize a transition or multiple transition select it and select the color in the properties view.
Transition routing
YAKINDU Statechart Tools comes with two different routing strategies for transitions: oblique and rectilinear routing. For a better understanding see the screenshot below. As you can see, rectilinear routing means that all transition segments are either horizontal or vertical, while oblique routing allows to have diagonal lines.
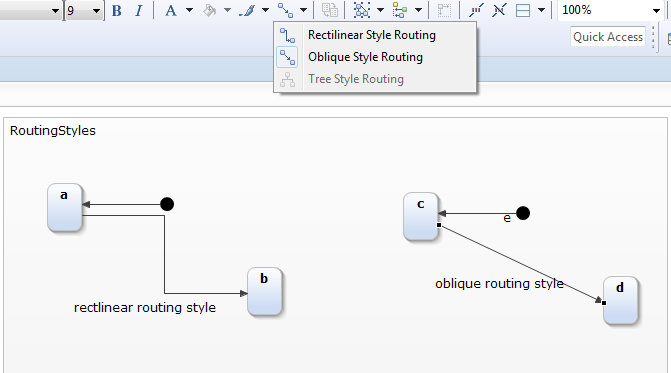
Again, this styling can be applied either individually on each transition, or globally for all new transitions created anywhere in the statechart by using the preference page (see screenshot above). Tree routing is no option in YAKINDU Statechart Tools.
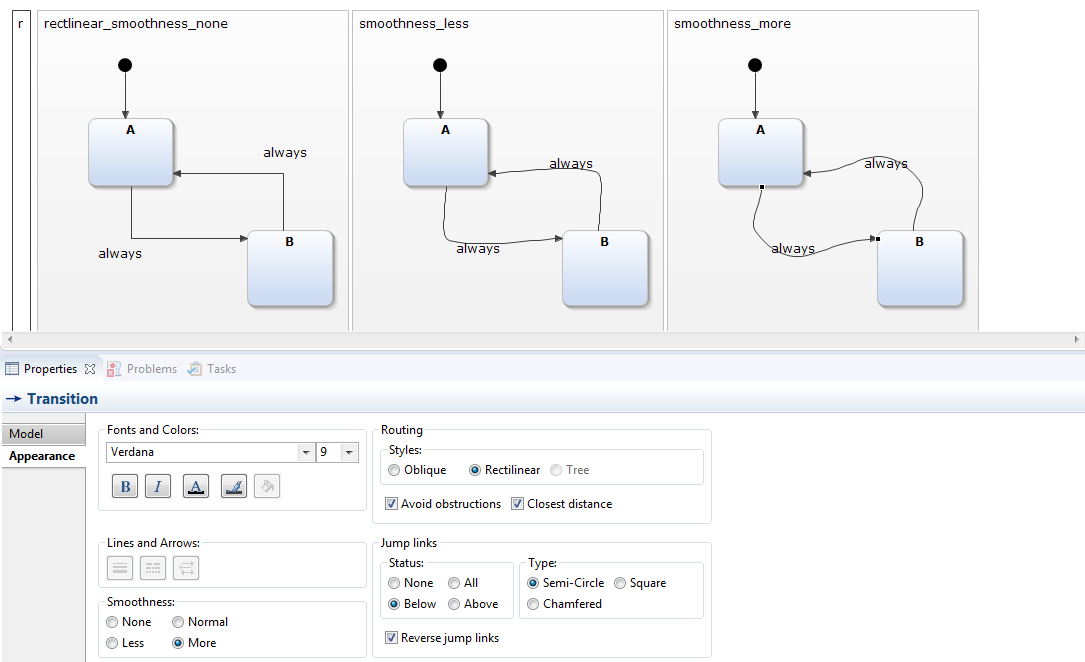
Smooth Transitions
The properties view tab “Appearance” makes it possible to “smooth” transitions, which means that they get curved. There are four smoothness levels: none (default), less, normal, and more. The image visualizes the differences between none, less and more. The normal and less are looking nearly similar.
Align states horizontally and vertically
You can align states to get a well-ordered arrangement. States can be aligned either horizontally (align top, align middle, align bottom) or vertically (align left, align center, align right). The reference defining where to align is the state you selected last. The image shows the same alignment (align left) with a different order of selection (see the numbers).
Decluttering statecharts by refactoring
To cleanup your statechart you can also edit and refactor it. You can split off parts of the statechart into multiple regions or use sub-statecharts and composite states.
Styling can help you to enhance the appearance of your statecharts. But be careful: If you use too many colors the statechart will look messy. The understandability might decrease instead of raise. My recommendation is to not use more than three different colors in small statecharts of, say, upto 20 states. If your statechart is larger, do not use more than five colors. Choose colors that differentiate clearly to emphasize certain parts of your statechart. So – try it yourself and happy styling ;)

Comments