
 Information: YAKINDU Statechart Tools Is Now itemis CREATE
Dynamic Probabilistic Safety Assessment (DPSA) is an important and viable means to analyze, understand, and thus mitigate risks associated with operating nuclear power plants. This article explains how YAKINDU Statechart Tools help to set up realistic accident models, which allow software used in DPSA, like MAAP5 and RAVEN, to generate all possible accident scenarios as a so-called Dynamic Event Tree (DET).
This means that it does not account for the time of occurrence of different events and their possible interactions. For this reason, methodologies that explicitly account for hardware/process/software/human interactions through time have been developed. Generally referred to as Dynamic PSA (DPSA) methodologies, these methodologies have demonstrated that accounting for such interactions can be crucial in the analysis of a number of accidents, particularly those involving software and/or human response. Dynamic Event Tree (DET) methodology is a particularly popular DPSA methodology, due to its similarity to the traditional ET/FT approach.
The Dynamic Event Tree methodology for exploring all possible accident scenarios
Given a set of events, typically failures and recoveries of several systems called upon the accident, and a sampling over their probabilities of occurrence, the Dynamic Event Tree (DET) is able to automatically generate all possible accident sequences. In DET, each combination of events corresponds to a different scenario.

Figure 1. A sample Dynamic Event Tree (DET) showing the evolution of pressure in a pipe with time, depending on the occurrence of certain events (Image taken from Rabiti, Cristian & Alfonsi, Andrea & Cogliati, Joshua & Mandelli, Diego & Kinoshita, R. (2014). RAVEN, a new software for dynamic risk analysis. PSAM 2014 - Probabilistic Safety Assessment and Management.)
For the DET generation, computer programs, usually referred as “codes” in nuclear engineering, are used as simulators to predict the behavior of the system under analysis. These simulator codes run coupled with another computer code that generates possible sequencing of events (driver).
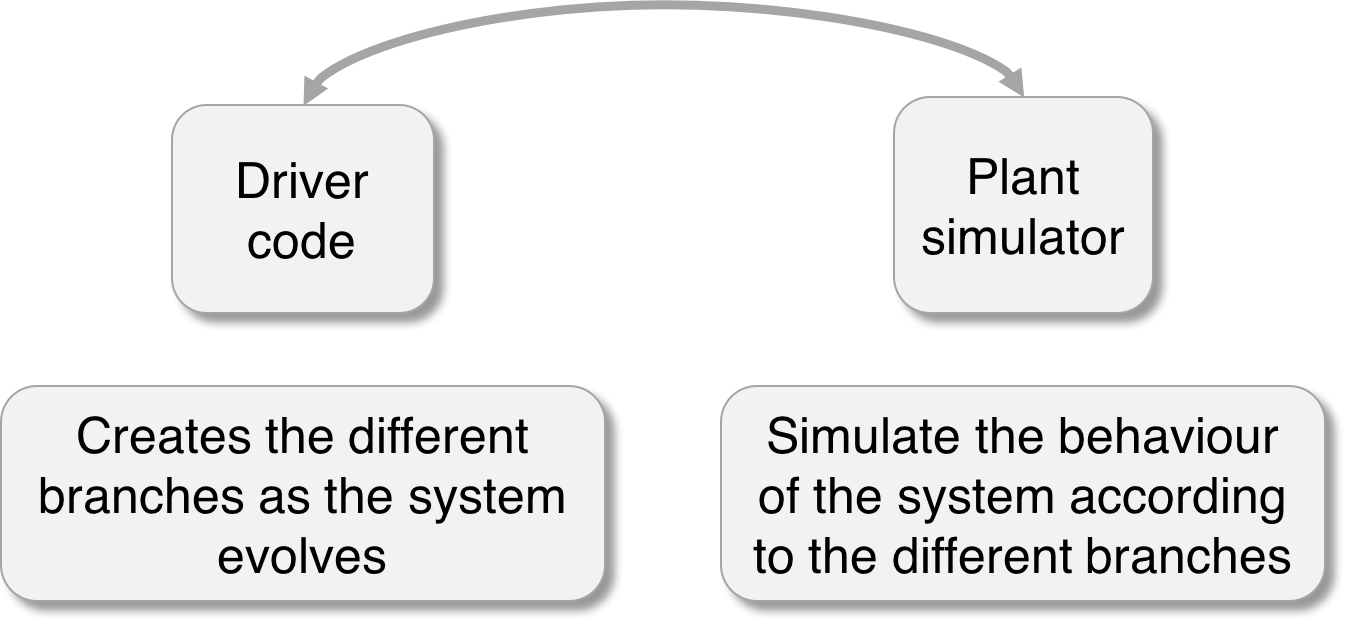 Figure 2. Coupling driver – simulator
In developing the simulator input model, which usually consists of a code script, the analyst faces some challenges. One of these challenges is that the order of occurrence of events in the accident sequence is not known a priori and the simulator needs to account for all possible interactions among occurring events. For instance, the failure of a component, e.g. the primary coolant pump of a nuclear reactor, and the failure of its power supply both lead to the same consequence, i.e. the unavailability of the pump. These events are distinct but interacting, especially if possible recoveries are considered. Furthermore, the interactions can depend on the a priori unknown event history within the sequence.
In this respect, it can be useful to have a visual tool that allows the analyst to simulate some sequences. This way the analyst can check if the control logic of the accident coded in the simulator model is working correctly. In this article, an application of YAKINDU Statechart Tools is presented for checking the correctness of the simulator control logic. Since DET generation employs massive computational resources, a preliminary check of the model can potentially lead to avoiding a waste of resources.
Checking control logic with YAKINDU Statechart Tools
YAKINDU Statechart Tools allow the visualization of how the system is evolving in terms of control logic as the accident sequence progresses. As an example, let’s consider the case of a room containing a heater. The heater can be “OK” or “NOK”, depending if it is working or fails, respectively. Also, when working, the heater can be in ON or OFF state, depending on the heater state (OK/NOK) and the room temperature T. The changes in T are determined based on heat transfer evaluations using a simulator. The heater is in ON state, if it is available (OK) and temperature T is lower than 15 °C. Similarly, it will be in OFF state, either if it failed (NOK) or the temperature T goes above the 20 °C threshold. A representation of this behavior is shown in Figure 3. Figure 3 also shows the differential equation describing the room temperature T evolution.
Stochastic failure and recovery of the heater is determined through given probability distribution functions (pdfs). In this example, exponential pdfs are used with parameters 𝜆 and µ for failure and recovery, respectively.
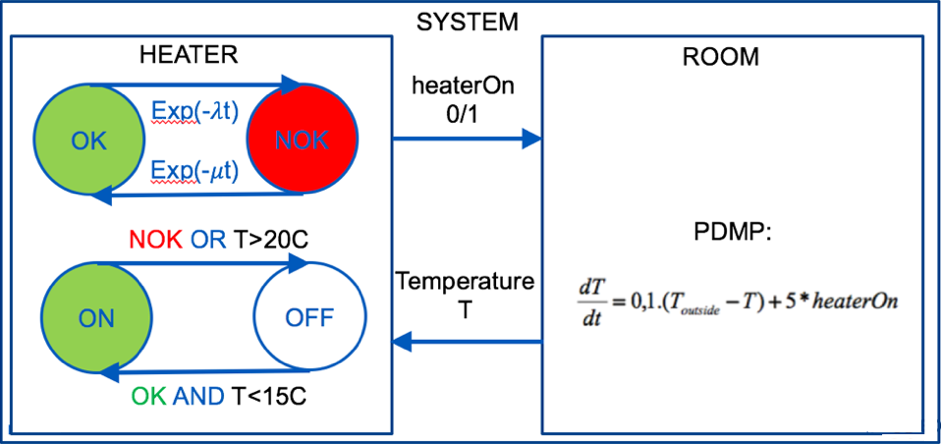 Figure 3. Heated room behavior
The YAKINDU statechart model corresponding to this system is shown in Figure 4.
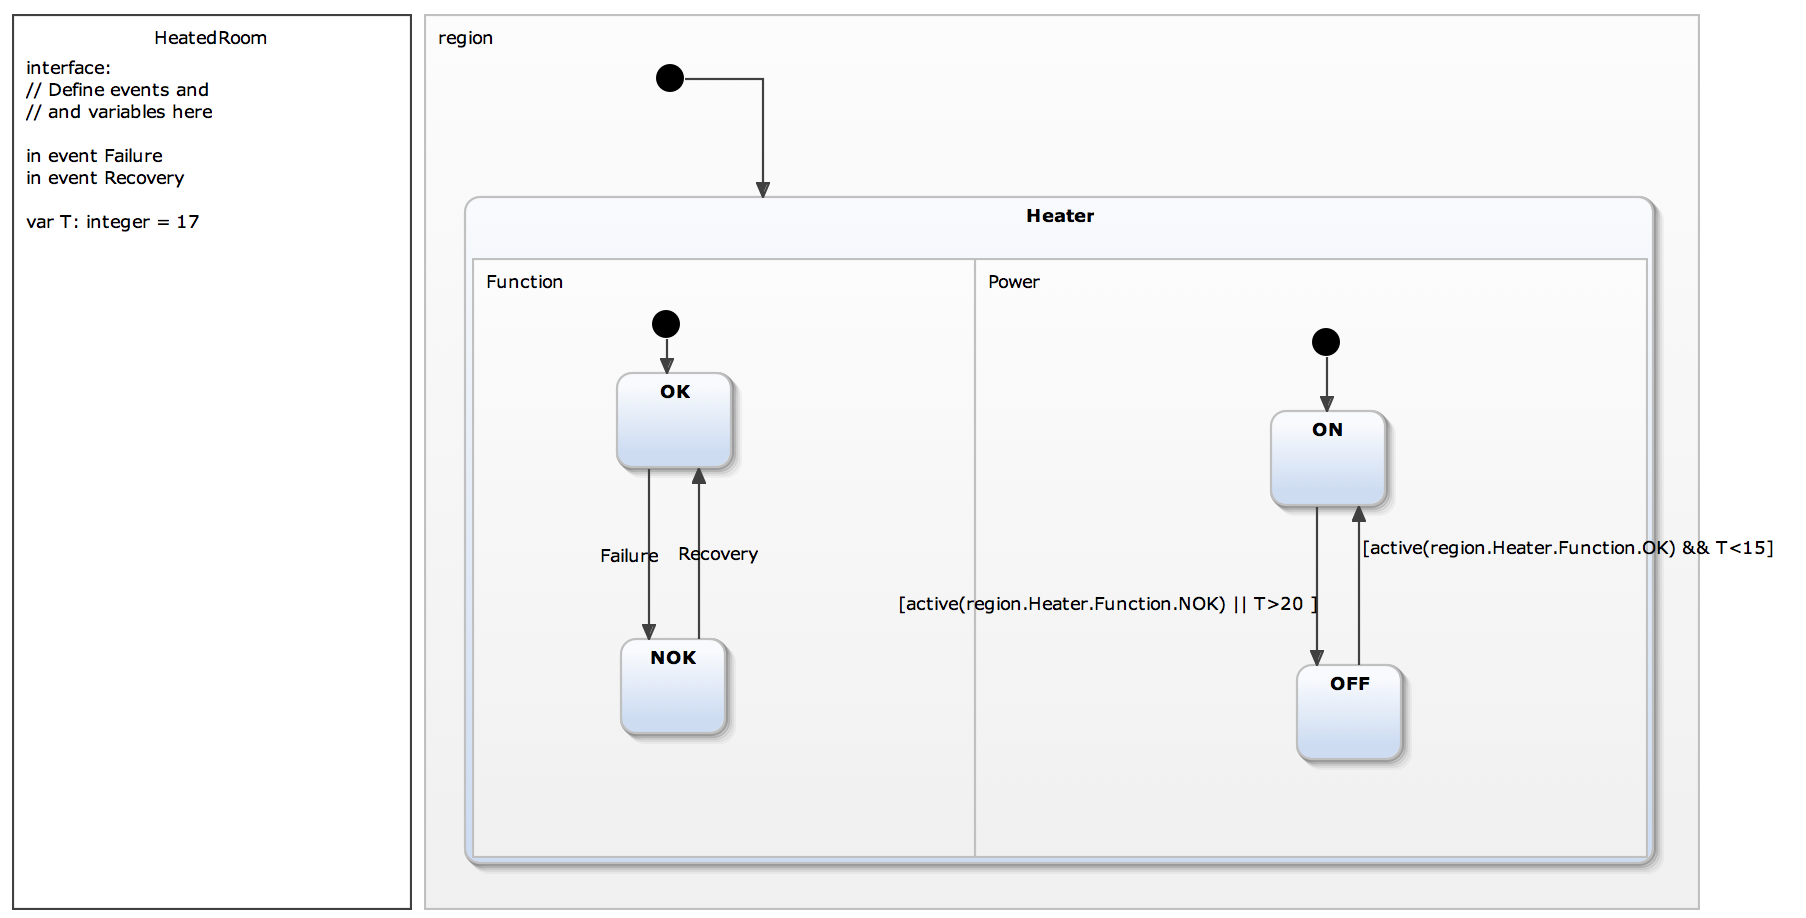
Figure 4. YAKINDU statechart model for the heated room
An interesting result of this example is for the case of the heater failing when it is ON and the room temperature is 17 °C. If recovered, the heater in this case does not switch itself automatically ON, even if it was ON before the failure. This happens because, according to the control logic, the temperature is not lower than 15 °C and therefore the heater cannot be ON. Subsequently, the analyst can verify whether this is the desired behavior. The statechart in Figure 4 reproduces the accident model implemented in the simulator. By simulating different sequences via YAKINDU Statechart Tools, the analyst can check if the model’s behavior reflects what is expected and coherent with physical considerations and set conditions and consequently identify possible errors in the code control logic. The use of the “region” and the “orthogonal state” in YAKINDU Statechart Tools allow simulating multiple states at the same time.
It should be mentioned that, in this approach, YAKINDU Statechart Tools do not take into account the evolution of system physical variables, e.g. temperature or pressure, as the system passes from one state to another. This limitation of the statechart simulator poses challenges in modeling operator actions that are based on the physical state of the systems. Physical variables can, however, be represented as external parameters, though fixed throughout the sequence, given as an input to YAKINDU Statechart Tools through its statechart simulation interface. They can also be modified manually during the execution of a statechart simulation.
Since only one sequence at a time can be simulated, not all the possible sequences can be simulated in case of a complex model. In this respect, a useful feature of YAKINDU Statechart Tools will be the “invariant” concept. An “invariant” is a global condition set by the user and which is expected to always be fulfilled for the model under analysis. If this condition is broken during the simulation, a warning message is sent to the user. Referring to the heated room example, a priori the analyst knows that the system cannot be simultaneously NOK and ON. If this happens nevertheless, it means that an error exists in the model code.
Getting closer to the physics using executable state machines
While the approach described above makes use of YAKINDU Statechart Tools' graphical statechart simulator only, it should be mentioned that it is also possible to generate the statechart as source code in various programming languages, namely Java, C, or C++. The generated source code can be integrated with user-developed code, providing an executable state machine as a submodule of the overall application. This makes it possible to directly read and modify statechart variables or to raise events in the state machine programmatically from extern.
For example, the user could develop some glue code in, say, the C programming language, that repeatedly and frequently retrieves the always-changing room temperature from the simulator and pass these values on to the state machine. The state machine, in turn, changes states depending on the temperature passing the thresholds. These state changes can then be forwarded to the simulator, e.g. to turn the heater on or off.
Having the statechart available as executable code also allows for executing a lot of different scenarios in short periods of time.
Applying Dynamic Event Tree and YAKINDU Statechart Tools in the real world
DETs are used in the nuclear industry for analyzing the evolution of accidental scenarios of nuclear power plants. In this case, the process explained above becomes more complicated:
-
The simulator does not just contain a simple differential equation, but it is a complex code (for example, MAAP5 – Modular Accident Analysis Program 5) which simulates how the entire nuclear power plant evolves along the accident and every time that a branching condition occurs.
- The number of branching conditions that in the example above accounts for a single failure and recovery only, increases tremendously.
If the entire plant is considered multiple systems have to be taken into account, each characterizing a different evolution of the plant. These systems are strongly interacting with each other. Therefore, the control logic for the simulator has to account for all these interactions and the corresponding input can become long. For this reason, I currently use YAKINDU Statechart Tools to reproduce the control logic of my thermal-hydraulic simulator for the analyzed accident. By simulating some sequences of the corresponding DET, I can check that the control logic is working correctly and there is no error.
This article is a collaboration between Claudia Picoco from The Ohio State University and Rainer Klute, software architect at itemis.
Comments